The topic of sourcing compensation is a hotly contested one. It always has been, and I suspect that it always will be. There are some who feel that sourcers are glorified administrative assistants and thus should be making right at minimum wage levels (if not less). There are others who feel that sourcing is an integral part of the hiring process as well as a valuable asset to other parts of an organization, and thus should be rewarded with six-figure incomes.
The purpose in conducting this sourcing salary survey was to take a look at sourcer compensation levels using a variety of different filters. Some results were expected, such as the fact that corporate sourcers make significantly more annually than their agency counterparts. Others were a little surprising, as you’ll see below in the infographic.
Perhaps most surprising was this: by taking your responses and breaking down, approximating, and averaging comp ranges, we discover that the average annual compensation for a sourcer is $73,000. That’s more than what most would have predicted.
Below we present the findings of the 2011 Sourcing Salary Survey.
Basic Data
- Total respondents: 238
- Corporate: 61%
- Agency: 26%
- Contract: 14%
- Geography represented
- North America (U.S. and Canada): 83%
- Europe: 5%
- Asia: 5%
- Australia: 4%
- Africa: 1%
- Middle East: 1%
- Central America: <1%
- Experience levels
- < 5 years: 60%
- >5 years: 40%
- Role
- Individual Contributor: 80%
- Manager and above: 20%
Note: we did not draw geographical comparisons from our data given the fact that a large majority of responses were from North America alone. In future surveys we hope to have a more geographically diverse sampling from which to draw conclusions.
Aside from the conclusions listed above in the infographic, we wanted to show a few extra graphs that presented some interesting results.
Corporate vs. Agency Compensation
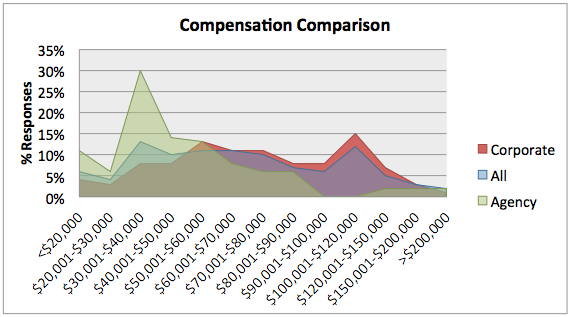
The percentages are based on total responses in the given categories. You’ll see with agency sourcers, annual compensation spiked around the $30,000-$40,000 range and then dropped quickly, where corporate compensation remained more steady until reaching the $100,000-$120,000 range. If we break these down and find approximate average compensations, here’s what this looks like:
- Agency compensation average: $51,00
- Corporate compensation average: $77,000
- Total compensation average: $73,000
Conclusion:
Agency sourcers make significantly less than corporate sourcers. We all pretty much expected to find that. But the surprise here is the average compensation level of sourcers based on our survey results — $73,000 is certainly higher than what many seem to think should be the standard. If you work this out to an hourly range, it’s just slightly more than $35/hour.
Individual Contributor vs. Management
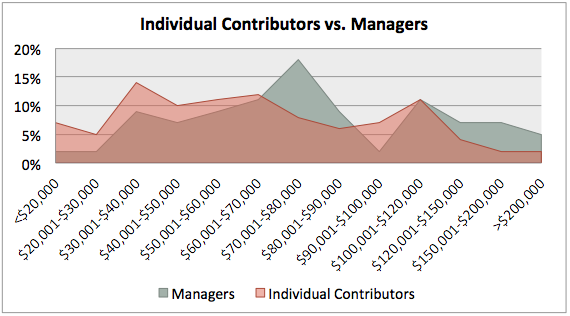
Things are still rather predictible when looking at the data comparing individual contributor vs. manager compensation levels. Aside from a peak at the $30,000-$40,000 mark for individual contributors and a peak at the $70,000-$80,000 mark for managers, for the most part the responses followed similar curves. But when you look at the approximated averages:
- Individual Contributor compensation average: $69,00
- Manager compensation average: $86,000
Conclusion:
As with most functions, reaching the management level will command a higher compensation. Though the peaks and valleys from visualizing our survey results fall in interesting places (for example, both management and individual contributors peaked had the same percentage of responses at the $100,000-$120,000 level).
Salary vs. Hourly Compensation
For this comparison, we took corporate, agency, and contract roles and compared comp levels based on those who are paid annual salaries vs. those who work on an hourly basis.
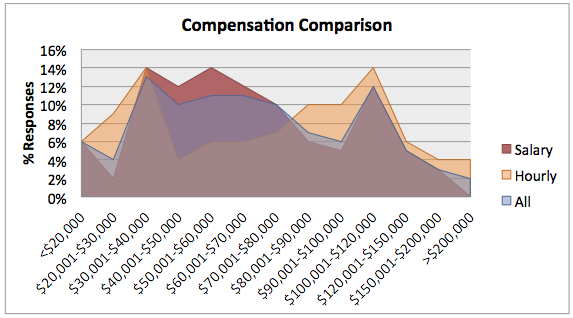
Here the results were a little different. On the salary side, as comp levels rose, the number of sourcers earning at those levels dropped off, whereas the percentage of hourly sourcers earning larger amounts rose with the comp level. The hourly responses spiked around the $30,000-$40,000 range (which most likely accounts for hourly full-time employees) as well as between the $80,000-$120,000 ranges (the higher levels of compensation are generally occupied by contract and project-based sourcers).
Here also, we see that salaried sourcers’ comp level is below the average:
- Salary compensation average: $68,00
- Hourly compensation average: $79,000
- Total compensation average: $73,000
Conclusion:
Though there were two spikes at significantly different comp levels, sourcing for hourly compensation has more potential to be financially rewarding. Those who’ve worked on a contract basis know this first-hand, though there is the risk that goes along with going from contract to contract — there is no guarantee that your contract will be renewed or that there won’t be a gap in between contracts.
Experience Level vs. Compensation
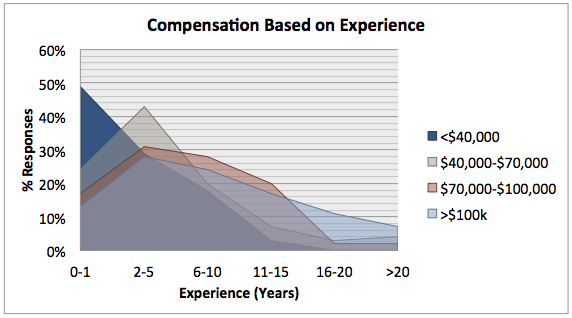
Here’s where things got pretty unusual. One might expect that as years of experience go up, so would comp level. From the results shown in the graph above, this doesn’t seem to be the case. For all comp levels except for <$40,000 responses peaked at the 2-5 year mark and fell from there. The fall was more gradual at the >$100,000 level, but you’d expect that at that comp level, the number of responses would rise as experience went up.
Conclusion:
This was a rather unexpected result, so I’m not sure how really to read it. One logical conclusion could be that people in sourcing roles move out of the field and into other non-sourcing type functions after getting a few years under their belt, which may account for the drop in numbers at higher experience levels. This could also be explained by the fact that the role of sourcing only recently (within the last 10-15 years for the most part) has become a separate role from recruiting, with a few exceptions. But that alone does not explain the compensation levels. I would be interested to hear other theories.
Additional Findings
61% of individual contributors do not make extra bonuses or commissions.
While nearly 2/3 of those who indicated they were individual contributors said they do not earn extra bonuses, here are some of the ways in which sourcers listed they earn commissions and monthly, quarterly, and/or yearly bonuses:
- Annual bonus based on company profitability (ranging from 10-25% base)
- Monthly/Quarterly bonus based on sourced candidate goals
- Percentage of each placement (ranging from 1% to 20% with lots of 7.5%)
- Flat bonus per placement (ranging from $100-2,500) with some based on meeting a minimum before being bonused
- Bonus pooling for non-recruiters based on closed searches
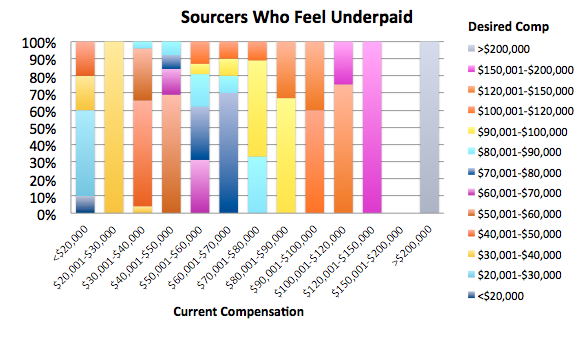
43% of sourcers feel they are underpaid at their current compensation level.
Of those who feel underpaid, an overwhelming majority believe that a fair compensation for them would be around $10,000 more than what they currently make. This was evident at every compensation level surveyed, as shown in the graph below.
Analysis, Comparisons, and Questions
One could spend days looking at the data in a myriad of different ways. The fact that we had very little response outside of the U.S. probably skewed our results as well, but they remain what they are. And as predictable as some of the results were, others were equally as puzzling. One of my colleagues noted,
What jumped out at me at first was that there are people earning well into the six figures. The second thing was how many are working for practically nothing. How does that happen? Are the low wage earners working at this only part-time? Are the top earners agency owners, or is there income inclusive of other elements, such as a hiring commission or executive search, etc.? Or are they from outside the U.S. and the income is being expressed in their native currency?
For one, we did separate out asking for annual compensation minus any bonuses and/or commissions, so there is one question answered. And we did ask for compensation to be described in U.S. currency. But we did not differentiate part-time work vs. full time. In the future, this should be a consideration to help provide the most accurate assessment as possible with this survey.
For comparison’s sake, I looked at a few other resources that share salary information for jobs — Indeed and Simply Hired. (Note: Salary.com is not included because searches for sourcer, technical sourcer, phone sourcer, names sourcer, recruiting sourcer, etc. yielded either no results or completely unrelated jobs….) Here’s what I found:
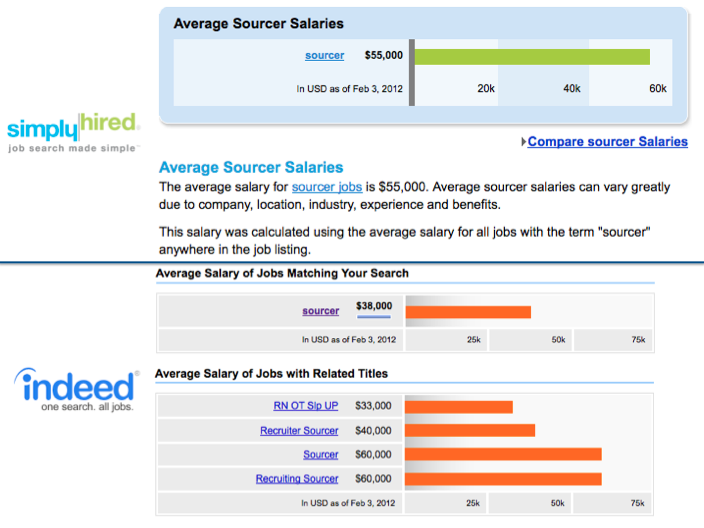
Obviously, there is a huge difference between the compensation information we collected directly from sourcing professionals, and these resources which automatically grab salary information from job postings. SimplyHired’s average is nearly $20,000 less than our findings, and Indeed’s is almost half of what we found. So what accounts for these drastic differences?
From the Horse’s Mouth
When you click on the SimplyHired ‘sourcer’ link, a list of jobs with the word “sourcer” come up. Same with Indeed. While many of them are actual recruitment sourcing jobs, there are some oddball ones mixed in. Therefore, one can assume that the salary data being collected is not completely accurate because jobs that aren’t actually recruitment sourcing jobs are being counted.
While our findings may also not be 100% accurate, we know that the data is being collected directly from sourcers who are in the trenches doing the work. The data collected is primary research.
Job Description vs. Actual Job Function
Another possible explanation of the disconnect between our findings and the data provided by other resources is that the jobs being described by lots of job postings for sourcers are different from the actual function of sourcing as defined by those who participated in the survey. For example, here is some verbiage from one of the sourcing positions listed via Indeed. The title of this job is ‘Sourcer/Recruiting Support’:
- Develops and implements sourcing strategies based on position requirements; identifies, evaluates and places job postings in appropriate sources such as social media, professional organizations, niche sites, Linked In, etc.
- Helps with initial candidate assessment by reviewing resumes and conducting screening activities
- Ensures the maintenance of accurate and concise records and reports concerning all phases of the recruitment process.
- Communicates with candidates regarding status, scheduling of interviews, process, etc.
The first two bullet points are certainly sourcing responsibilities (though not much strategy involved in posting jobs), but the second two would be more for an administrative assistant or recruiting coordinator type role.
There are still plenty of great sourcing jobs that are more in line with our compensation findings — like this one, this one, and this one. But it still doesn’t explain the low comp levels that Indeed and SimplyHired have collected and shown as average for sourcers. I would be interested in hearing other theories on this.
* * *
At the end of the day, I am more inclined to believe the data that we have collected from you, our community, over data that is scraped automatically from job postings. Hopefully the next time we run this survey we will be able to get more of a feel of the international levels of compensation and thus draw comparisons across the globe. If you would like to review the raw results of our survey you can click here to download and review the survey in PDF form.


